62DAC Signal Integrity Study
What on this board limits two AD1862s, and what to change to get their full 20-bit performance. Every number here comes from free tools run on the actual KiCad layout.
Where the board stands
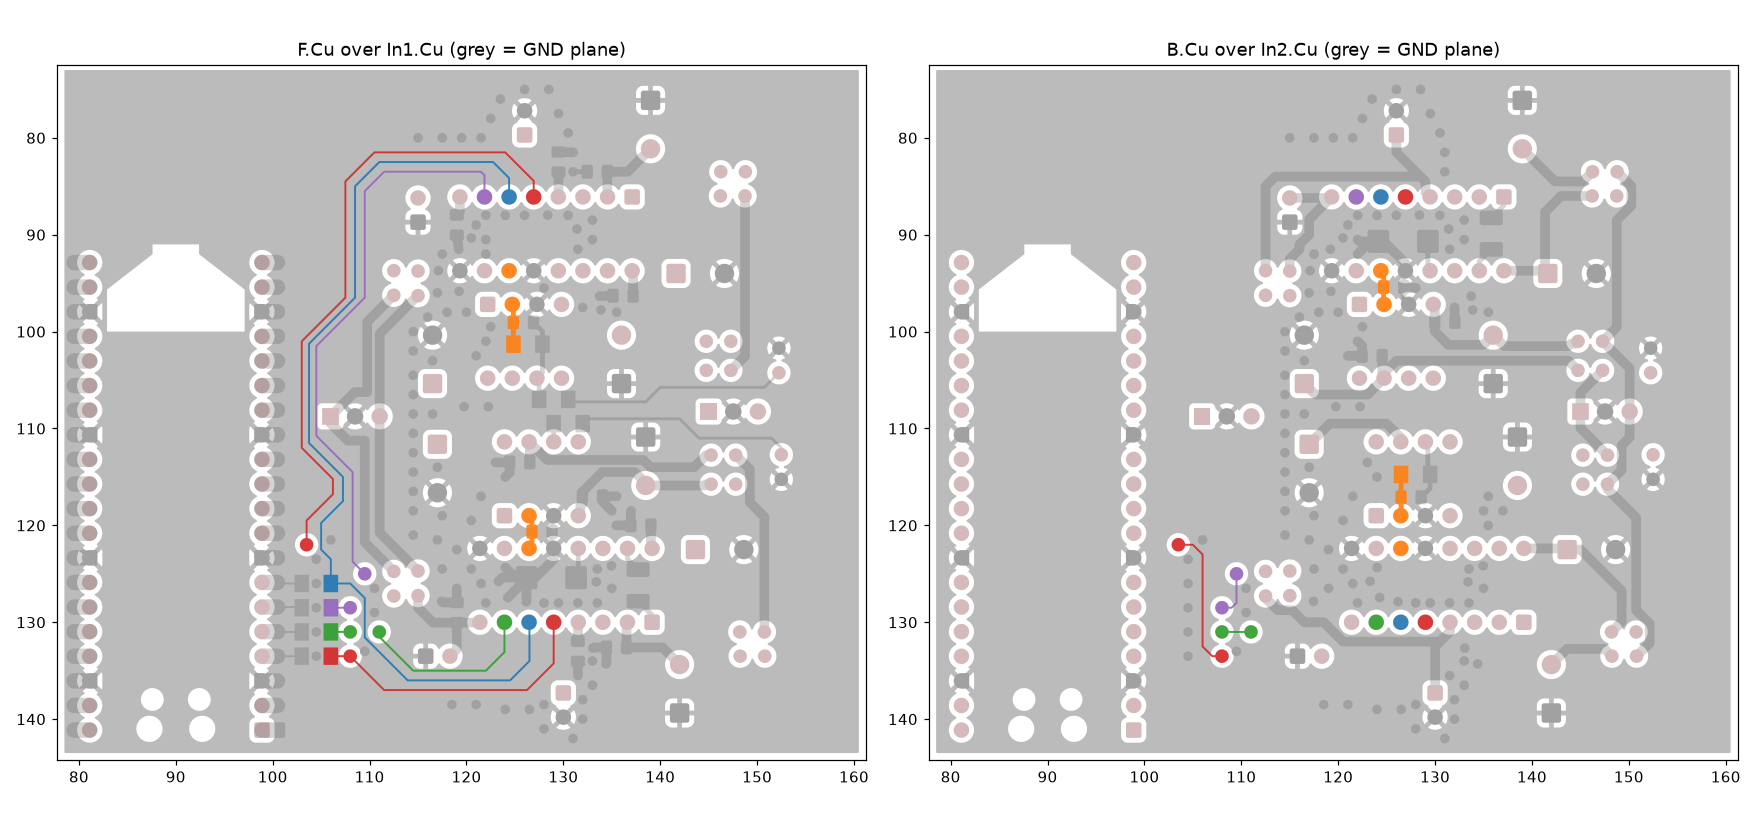
The layout is fundamentally sound: two solid ground planes, short summing nodes, decoupling within 2–3 mm of every AD1862 supply pin. The real limits are all about timing: how the Pico produces its sample clock, how the shared clock and latch lines are routed, and how the firmware drives them.
spurs −75 to −80 dBFS (10–20 kHz tone)
exact clock: none
CLK at U1: 13.9 ps/mV
point-to-point: 0.35 ps/mV
CLK → data: ≤ 12 mV
with 10 µF X7R added: ~0.02 Ω
worst ringback 2.24 V > VIH 2.0 V
1/90–1/50 of an LSB·sample
LE edge: 0.6–0.8 fC, ≈ −150 dB
(1 LSB at the output ≈ 2.7 µV)
Changes, ranked by benefit for effort
Firmware changes cost nothing and address the largest effect, so they come first. Each item says where the evidence comes from: simulated on this layout, diyAudio (post numbers in the forum's AD1862 thread, no. 354078), or datasheet.
- Run the PIO from an exact multiple of the sample rate
Set clk_sys to 110.25 MHz for 44.1/88.2/176.4 kHz (PLL: REFDIV 2, FBDIV 147, post-dividers 4 and 2; VCO 882 MHz), or to 129.6 MHz for 48/96/192 kHz (VCO 1296 MHz, ÷5÷2). Write the PIO program so every sample takes exactly 2500 (or 2700) system clocks with an integer divider. Both clocks are within the RP2040's 133 MHz rating, and only firmware changes.
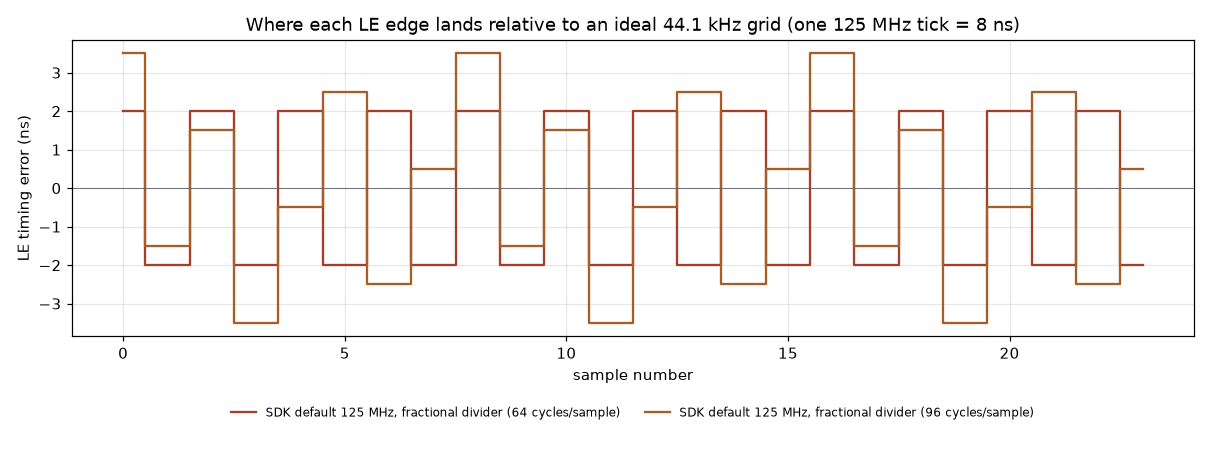
With the SDK's 125 MHz and a fractional divider, LE edges wander by 4–7 ns in a fixed pattern, giving spurs of −75 to −80 dBFS on a 10–20 kHz tone. With the exact clock that error is zero; what remains is the PLL's random jitter, which the datasheet does not specify. Changing sample-rate family means re-locking the system PLL; USB runs from its own PLL and is unaffected. The DAC then sets the rate, so USB audio must run in asynchronous mode with a feedback endpoint.
simulated (timing model) · RP2040 datasheet §2.18, §3.5.5
- Stop the clock before LE falls, and keep the bus static in silence
Shift the 20-bit word right-justified, stop CLK, hold DATA, then drop LE 3–4 bit periods later. During silence, hold CLK, LE and DATA static. The PIO program can do this at no cost.
The simulated 51–88 mV of CLK→LE crosstalk then never coincides with the LE edge, so the T-split's threshold shelf has no noise to turn into sample-time jitter. Builders on the thread measured a sample-rate residual of about 1 µA equivalent that disappears when the clocks stop.
simulated · diyAudio #3957, #4277, #6513, #6533–6534
- Keep the RP2040 pads at slow slew and 4 mA drive (the defaults)
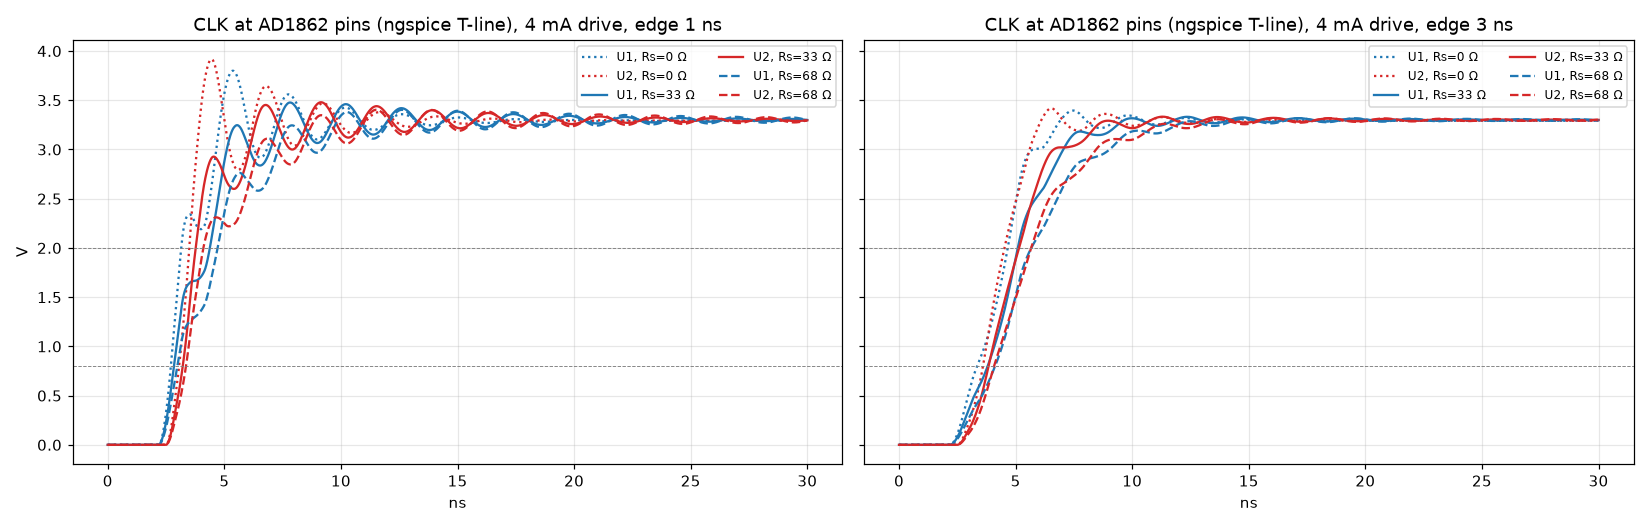
A 3 ns edge cuts the T-split's jitter sensitivity at U1 from 13.9 to 1.15 ps/mV on CLK and from 3.8 to 1.1 ps/mV on LE. It also reduces CLK→LE crosstalk from 88 to 51 mV. Do not enable fast slew on these four pins.
simulated (ngspice + openEMS)
- Give each DAC its own LE pin, and ideally its own CLK pin
Route two Pico GPIOs instead of one, each through its own series resistor near the Pico. About 27 Ω suits 4 mA drive on these 67 Ω traces. PIO side-set toggles both pins on the same cycle, so the DACs stay in step. Both DACs then see a clean single ramp at 0.35 ps/mV, and the 405 MHz tree resonance disappears.
simulated · 2 resistors + 2 short traces
- Re-time LE at the DACs from a low-jitter audio oscillator
Feed a 45.1584 or 49.152 MHz audio oscillator (or half that) into GPIO20 (GPIN0, up to 50 MHz) and pace the PIO from it: either run clk_sys from it, or have the PIO wait on its edges. Put a dual D flip-flop (74LVC74 class) beside the DACs, clocked by the same oscillator, so each LE edge comes from the oscillator rather than from the Pico's PLL and output pins.
Each half of the flip-flop drives one DAC over a short trace, which also removes the T-split. Assuming about 2 ps of oscillator jitter, the sample-time error stays below −135 dBFS even for a full-scale 20 kHz tone.
simulated (timing model) · RP2040 datasheet §2.15 · diyAudio #870, #944, #1787
- Add 10 µF X7R next to each 100 nF on ±VL and ±VS
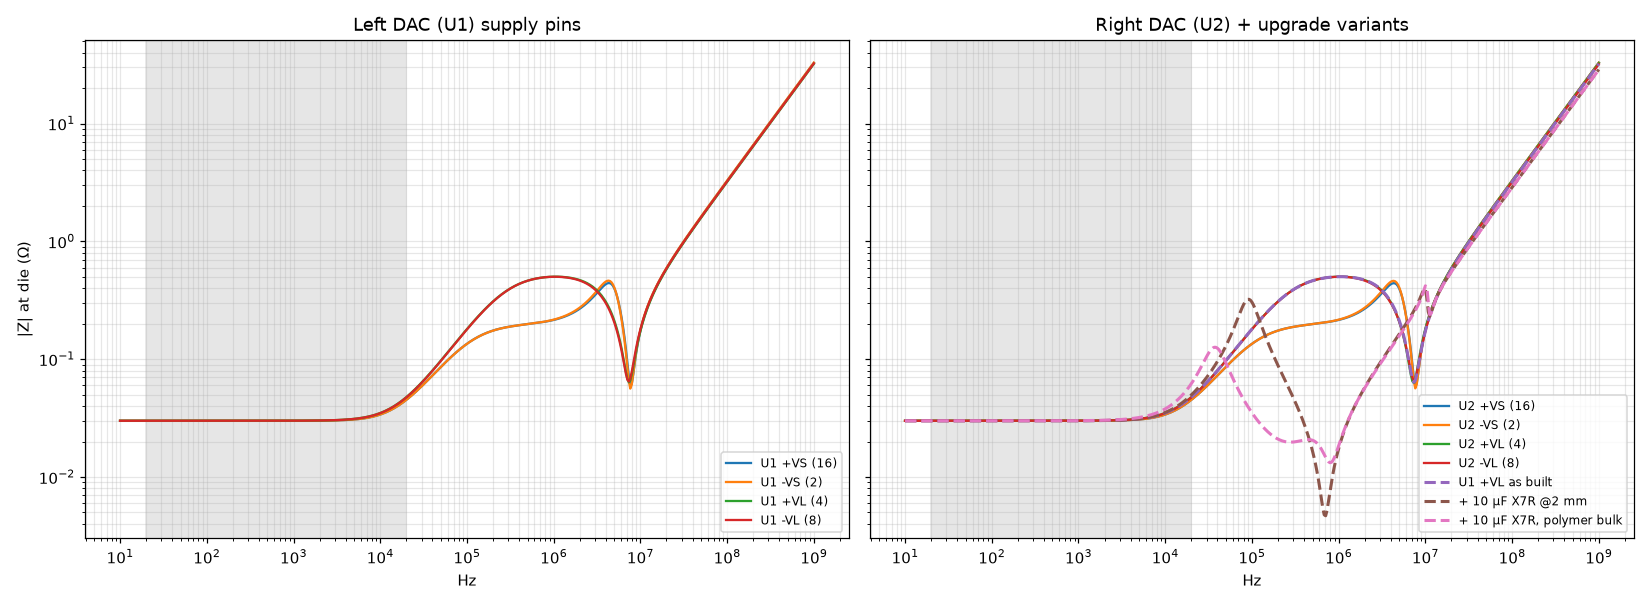
This flattens the 0.2–0.5 Ω region and removes the 4.5 MHz anti-resonance; impedance from 200 kHz to 5 MHz drops to about 20 mΩ. It leaves a mild 0.3 Ω bump near 100 kHz, still well above the audio band.
simulated (ngspice PDN model)
- Spend the effort on the regulators, not on more board capacitance
Below 20 kHz the rail impedance is the regulator's own. Low-noise LDOs (LT3045/LT3094 class) are what builders used for their best results. Keep ferrite beads off the analog rails.
simulated · diyAudio #893, #2819, #11631
- Put a GND via within 0.5 mm of each signal via
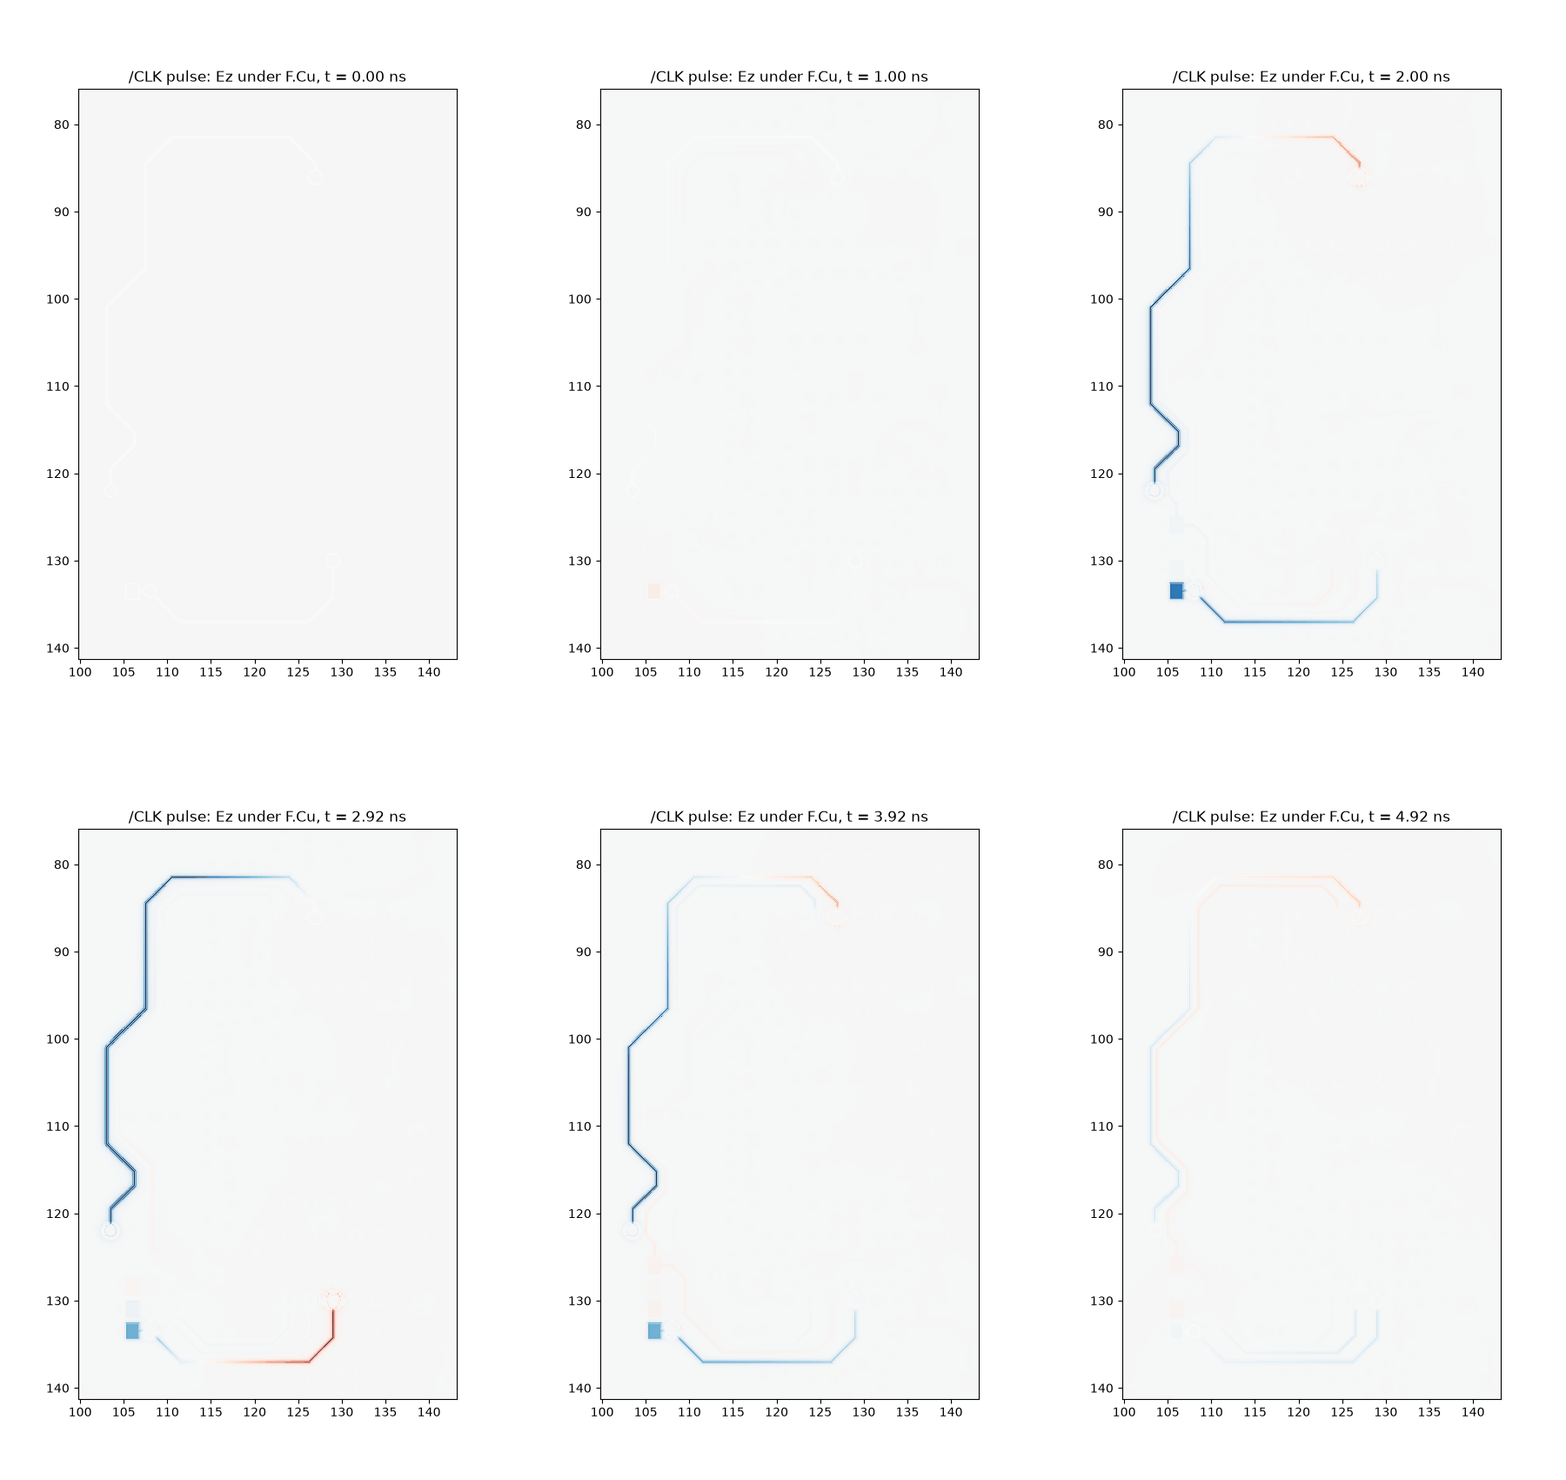
The six vias on CLK, D_L and D_R currently have their nearest ground via 1.6–2.6 mm away. The return current visibly spreads at those layer changes.
simulated (return-current map)
- Use C0G for the 47 pF caps, and leave room for a summing-node shunt
C31, C36, C50 and C51 should be C0G. Optionally add a do-not-populate footprint for a 1–2 nF C0G shunt from the summing node to ground, as in the AD797 data sheet's AD1862 circuit. Builders disagree on its value.
diyAudio #10842, #1970, #2716, #4960
- Leave the MSB trim unpopulated, and protect the supply order
Trim only with an FFT at −60 dBFS; a mis-set trimmer adds 20–30 dB of odd harmonics. Because each rail has a removable jumper, add a Schottky so −VL can never go more negative than −VS.
diyAudio #4770–4772, #10842 · datasheet abs. max.
How the board was simulated
The copper geometry comes straight from 62DAC.kicad_pcb through KiCad's own polygon engine: every track, pad, via barrel and filled zone, per layer. The stackup is JLC04161H-7628: 0.21 mm prepreg (εr 4.4) between each outer layer and its ground plane, and a 1.065 mm core.
- Full-wave: openEMS 0.37 FDTD, built from source and run on the M1 GPU through Metal. The model covers the digital bus, both AD1862 sockets and both I/V stages: a 43 × 65 mm crop, 11.2 million cells. All 31 capacitors in that area are series R‑C elements. The driven line has a 73 Ω source (33 Ω series resistor + ~40 Ω RP2040 pad); quiet lines have 73 Ω at the Pico end; each DAC input is 5 pF; each I/V summing node is 50 Ω.
- Circuit: ngspice transmission-line models of the CLK and LE trees for sweeps; a PDN model with the measured cap-to-pin distances.
- Sample clock: a timing model of the RP2040 PIO divider (datasheet §3.5.5) and PLL limits (§2.18), with the NOS output spectrum for each clocking scheme.
- Ground drop: a resistive solver on the rasterised In1 + In2 fill, tied by every GND via and pin barrel.
Validation
| 0.2 mm trace on F.Cu over In1 | Z0 | εeff | Note |
|---|---|---|---|
| Closed form, zero-thickness strip (Hammerstad–Jensen) | 72.8 Ω | 3.16 | reference for the FDTD sheet model |
| Closed form, 35 µm copper | 67.0 Ω | 3.19 | what the real board has |
| openEMS, 0.2 mm cells, lines on the edges | 42.5 Ω | 3.52 | too coarse |
| openEMS, 0.1 mm cells | 62.0 Ω | 3.26 | converging |
| openEMS, 0.15 mm with the ⅓–⅔ edge rule (used for the board) | 73.8 Ω | 3.19 | within 1.4 % of the sheet reference |
The ngspice and openEMS CLK waveforms agree on the shape: overshoot 0.12–0.18 V at a 1 ns edge, the same threshold shelf at U1, and the same ~405–430 MHz ringing. The tree rings for about 20 ns, longer than is practical to simulate, so each probe's tail after the pulse was extended with the board's own natural modes, fitted jointly across all probes. Tail-fit error is 2–11 % on most probes and 23 % on IOUT_L. Treat the coupling figures below as ±25 %.
The Pico's clock sets the sample instants
In a non-oversampling DAC each sample reaches the output the moment LE falls, so any error in when LE falls becomes an amplitude error. The PIO program generates LE, and the PIO runs from the system clock through a 16.8 fractional divider. The datasheet describes it as first-order delta-sigma: to reach a non-integer ratio it stretches some periods from n to n+1 system clocks. At the SDK's default 125 MHz, 44.1 kHz needs 2834.47 clocks per sample, so the LE edges land on a grid of 8 ns ticks in a repeating pattern.
The model moves each step of the NOS staircase by its LE error and computes the output spectrum for a −1 dBFS tone. The output is quantised to 20 bits, so the AD1862's own floor is visible for comparison.
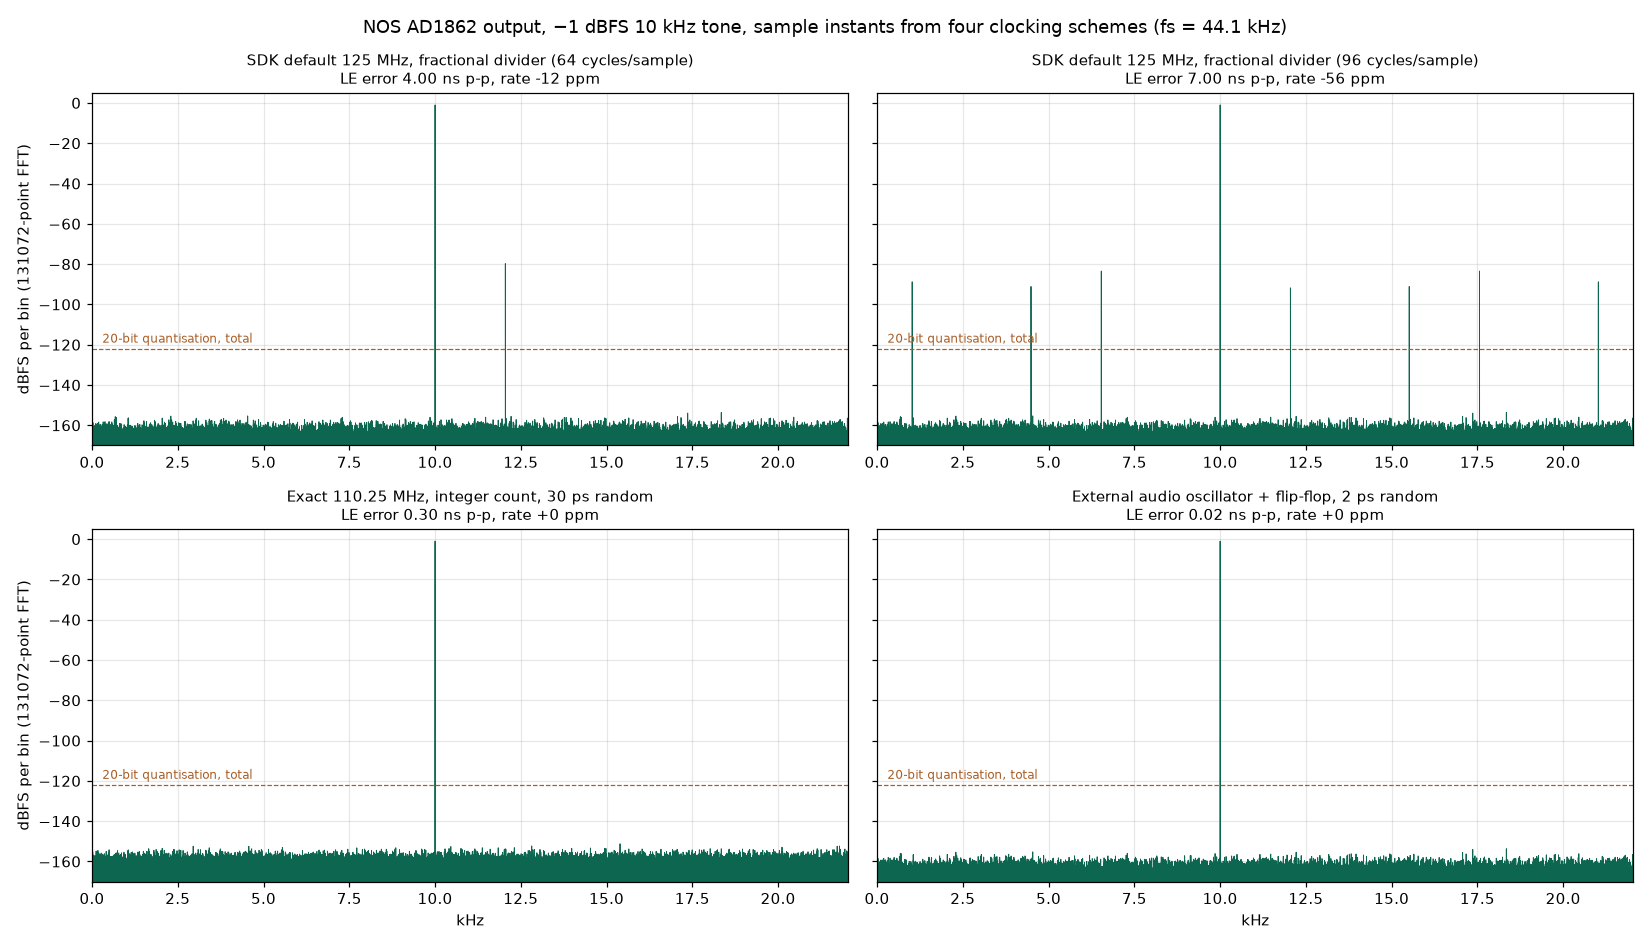
| Clock scheme | LE error | 1 kHz tone | 10 kHz | 20 kHz | Rate error |
|---|---|---|---|---|---|
| 125 MHz, fractional divider, 64 cycles/sample | 4 ns p-p | out of band* | −80 dBFS | −76 dBFS | −12 ppm |
| 125 MHz, fractional divider, 96 cycles/sample | 7 ns p-p | −98 dBFS | −79 dBFS | −75 dBFS | −56 ppm |
| Exact 110.25 MHz, assumed 30 ps random | 30 ps rms | −136 dBFS | −117 dBFS | −113 dBFS | 0 |
| Audio oscillator + flip-flop, ~2 ps | 2 ps rms | −159 dBFS | −140 dBFS | −137 dBFS | 0 |
Values are the total jitter error from 20 Hz to 20 kHz relative to full scale, for a −1 dBFS tone at 44.1 kHz. * With 64 cycles the pattern alternates every sample, so a 1 kHz tone's error lands at 21.05 kHz, just above the audio band. Where the spurs fall depends on firmware details.
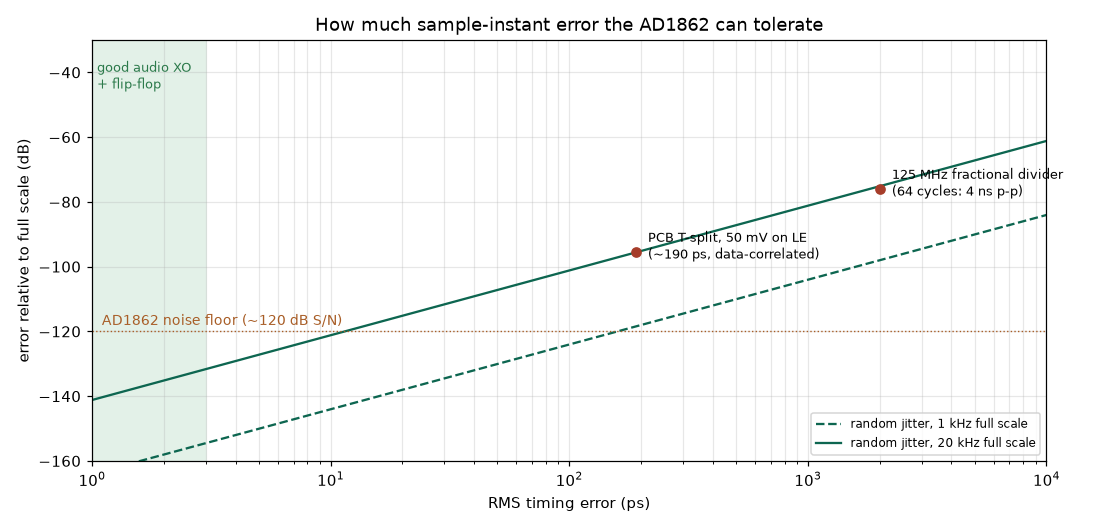
With an exact clock, the remaining random jitter comes from the PLL and the Pico's output pins. The datasheet gives no figure for it, so the chart below shows what any amount costs. Staying under the AD1862's ~−120 dB floor takes about 10 ps RMS for a full-scale 20 kHz tone, or about 160 ps at 1 kHz. A good audio oscillator re-timed by a flip-flop sits at a few picoseconds.
Clock and latch edges at the AD1862 pins
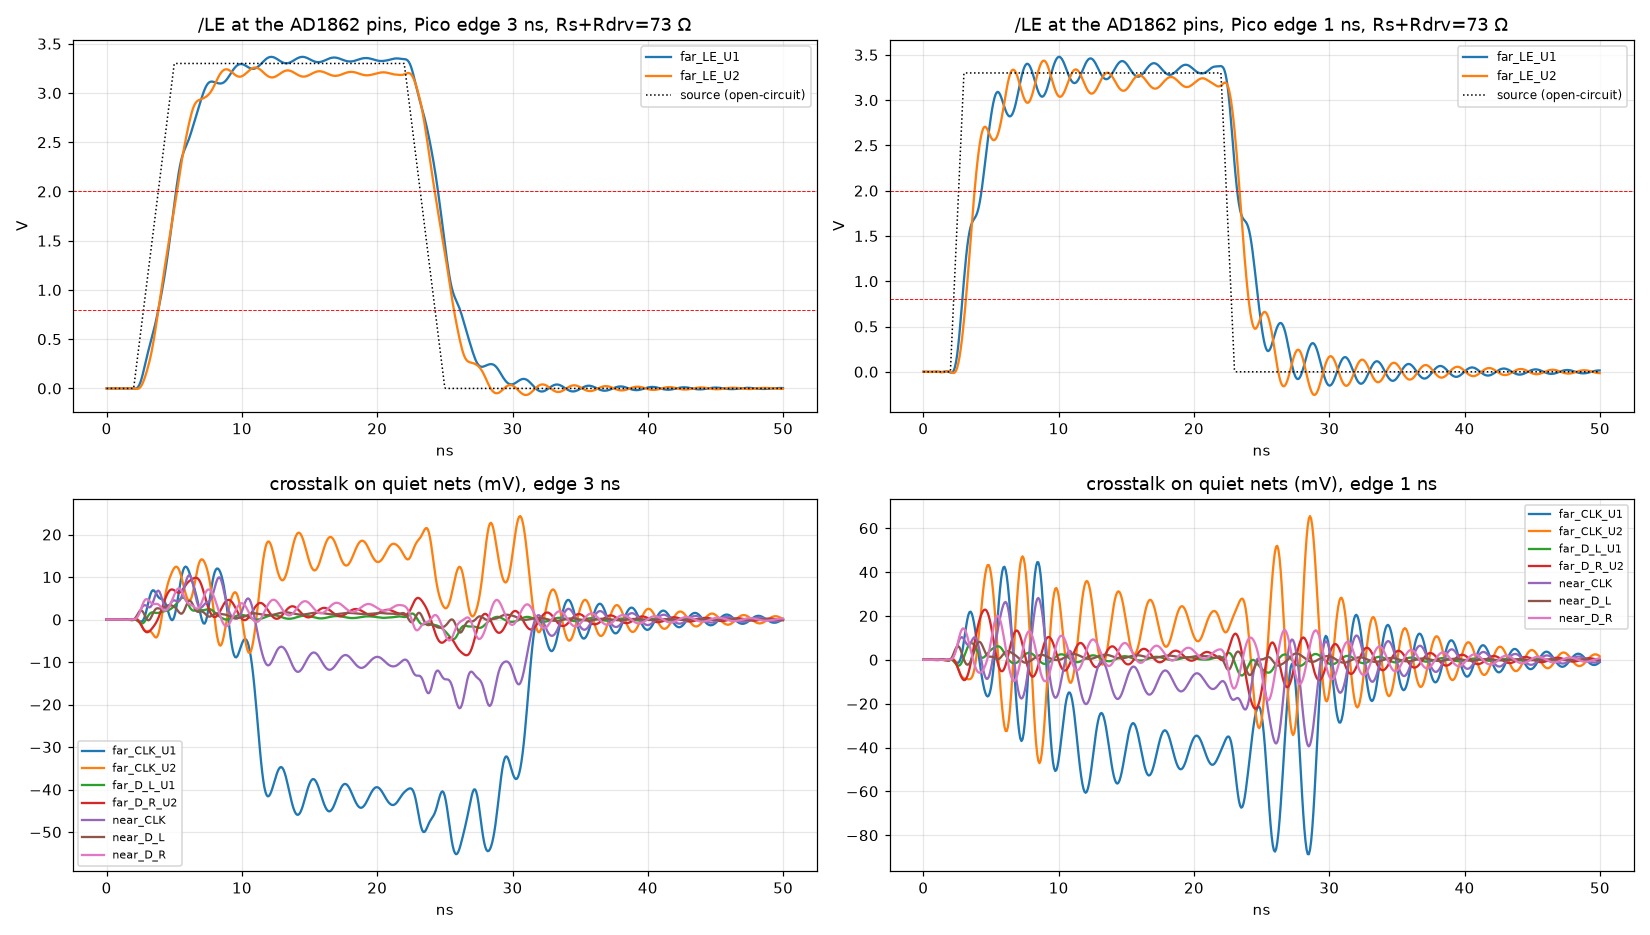
CLK and LE each leave one Pico pin, pass one 33 Ω resistor, then split. CLK runs 27.8 mm to U1 and 80.2 mm to U2; LE runs 31.9 mm and 65.3 mm. The near DAC therefore gets its edge in two steps: half the swing arrives at once, and the rest waits for the reflection from the far branch. With a fast edge, that step lands inside the 0.8–2.0 V input threshold band.
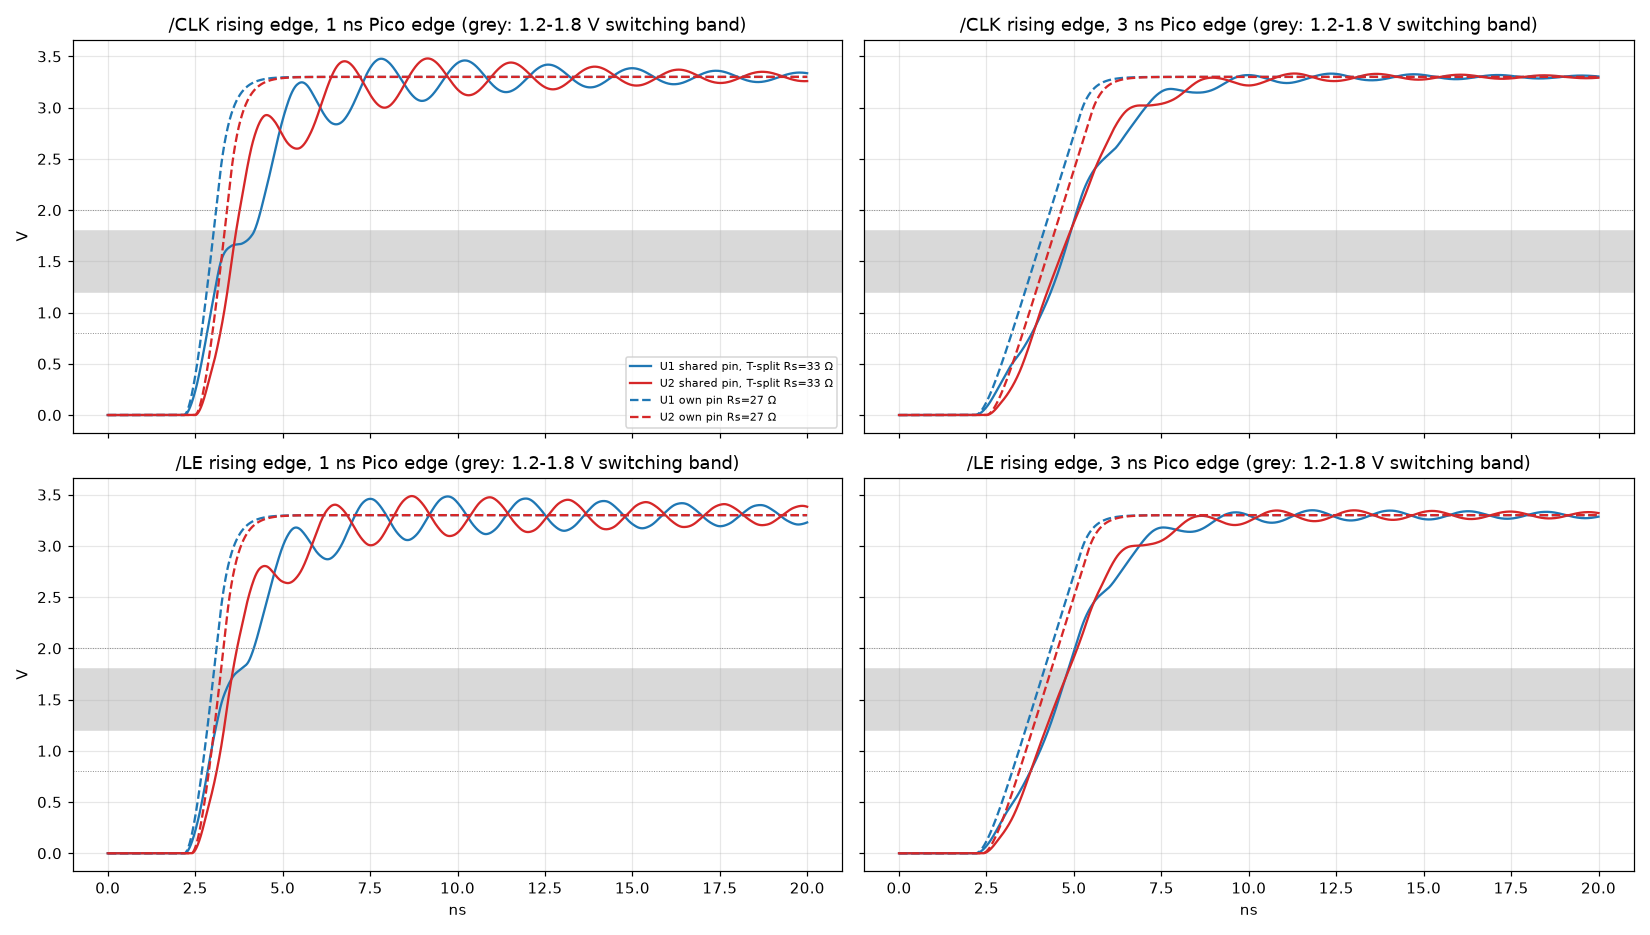
| Line · edge | Topology | Time in 1.2–1.8 V, U1 | Timing shift per mV of noise, U1 | U2 |
|---|---|---|---|---|
| CLK · 1 ns | shared, T-split (as built) | 1.14 ns | 13.9 ps/mV | 0.47 ps/mV |
| LE · 1 ns | shared, T-split (as built) | 0.74 ns | 3.84 ps/mV | 0.51 ps/mV |
| CLK or LE · 1 ns | own pin per DAC, 27 Ω | 0.20 ns | 0.35 ps/mV | 0.35 ps/mV |
| CLK · 3 ns | shared, T-split (as built) | 0.57 ns | 1.15 ps/mV | 1.17 ps/mV |
| LE · 3 ns | shared, T-split (as built) | 0.57 ns | 1.09 ps/mV | 1.19 ps/mV |
| CLK or LE · 3 ns | own pin per DAC, 27 Ω | 0.55 ns | 0.92 ps/mV | 0.92 ps/mV |
What this means in audio terms. Suppose 50 mV of data-correlated noise sits on LE while it falls at U1 with fast edges. That moves the sample instant by about 190 ps, which for a full-scale 20 kHz tone is an error near −96 dBFS, far above the AD1862's ~−120 dB floor. Point-to-point routing brings that to about −116 dBFS. A stopped clock removes the noise source itself.
TDR and input impedance of the CLK tree
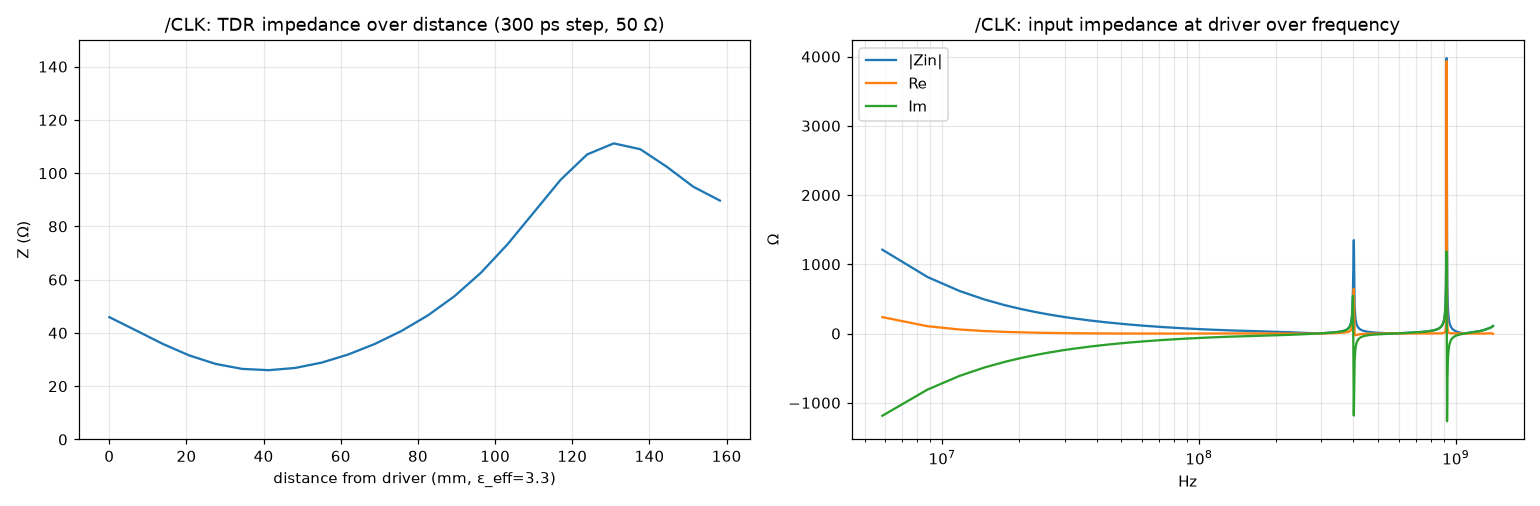
Looking in from the 33 Ω resistor, the driver sees 26–46 Ω for the first few centimetres: the two 67 Ω branches in parallel, pulled lower by the vias and DAC pins. The input impedance has sharp anti-resonances at 405 MHz and about 930 MHz. At those frequencies the source can't absorb energy, which is why the tree keeps ringing. Spatial resolution of this TDR is about 25 mm, set by the 1.4 GHz bandwidth of the run.
How much digital noise reaches the analog side
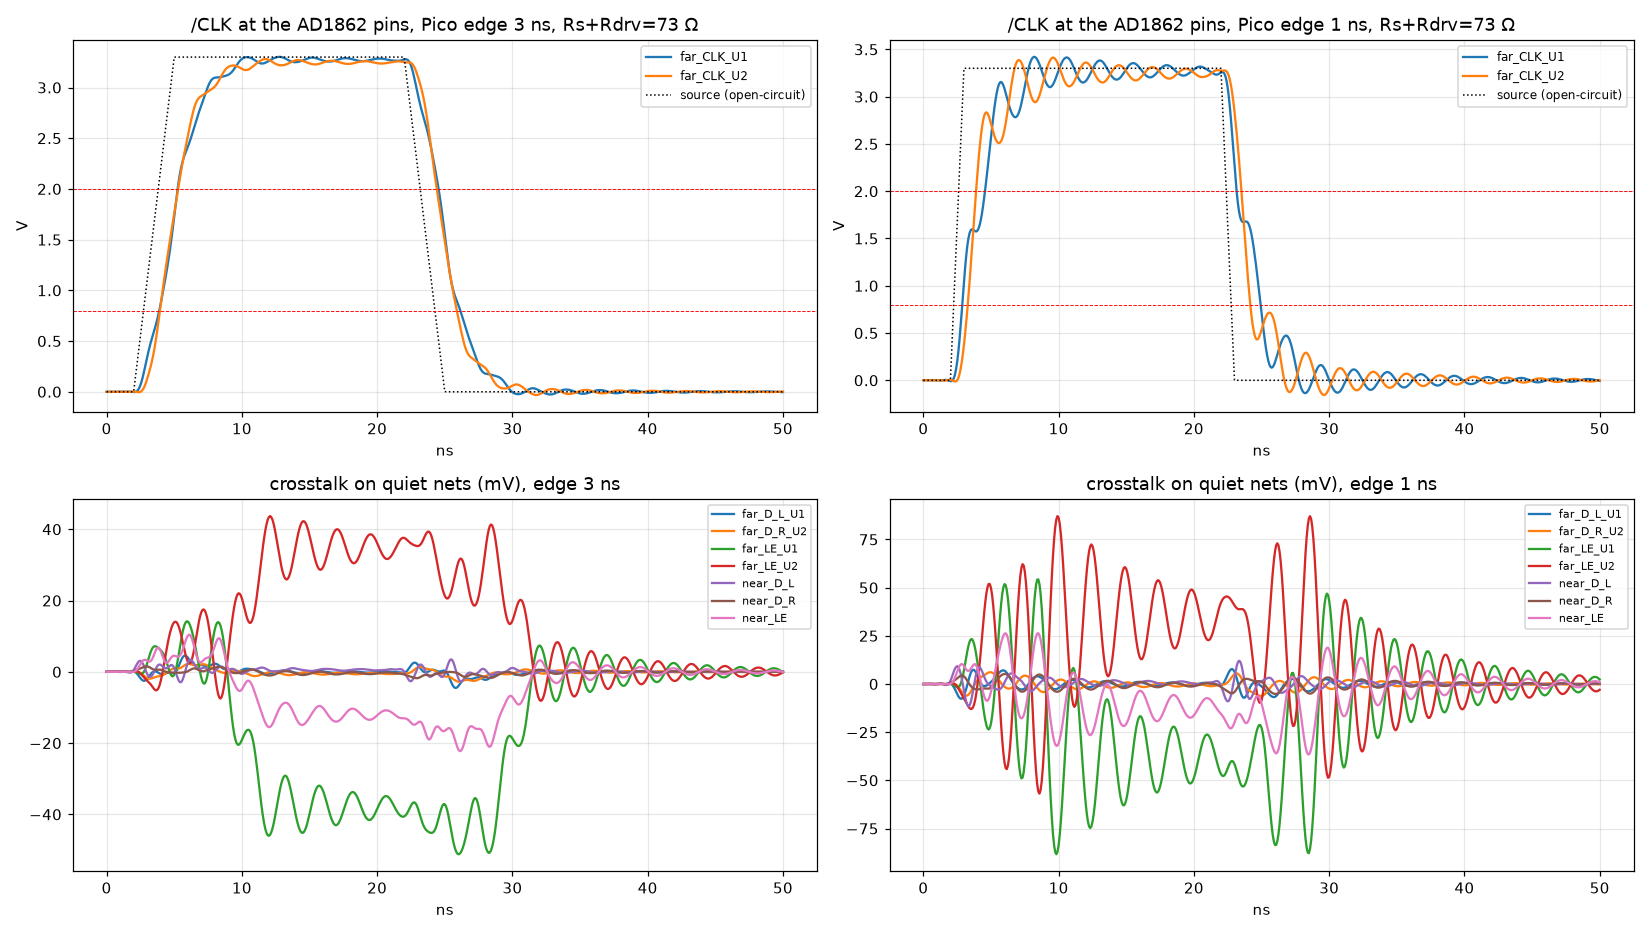
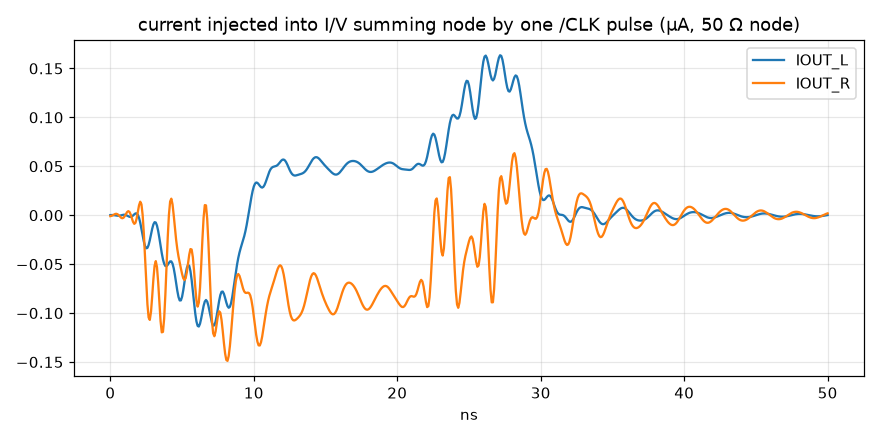
The I/V summing node (AD1862 pin 11 to OPA134 pin 2) is only 3.4 mm long on each channel, and it sits away from the bus. One CLK pulse pushes 0.15–0.34 µA peak into it. The net charge per edge is 0.5 fC on the left channel and 0.7–0.8 fC on the right. One LSB held for one 44.1 kHz sample is 43 fC. Assume 32 clock edges per sample that all add up instead of cancelling in rising/falling pairs. The result is about 1 nA of average current, roughly −120 dB below the ±1 mA full scale, which is the AD1862's own noise floor. In practice the pairs largely cancel.
With LE driven instead
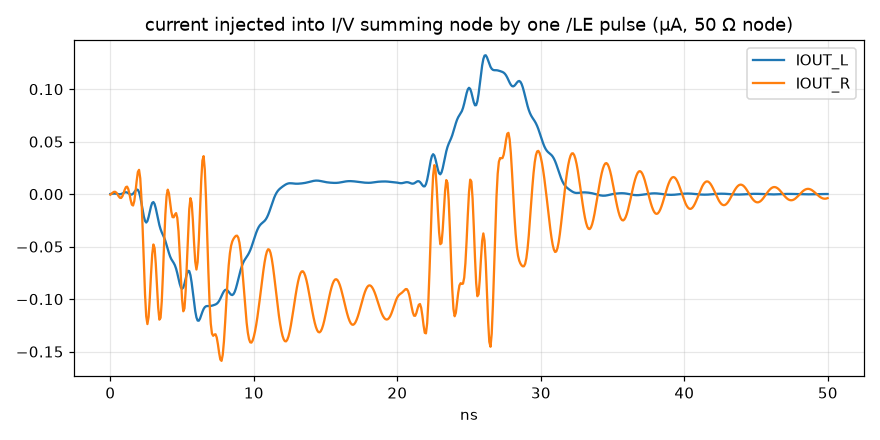
LE's falling edge is the instant the AD1862 updates its output, so a second full-board run drove LE and kept CLK quiet. The LE edge injects 0.6 fC into the left summing node and 0.7–0.8 fC into the right. It happens once per sample and is the same every sample, so it's independent of the data. As an average current it comes to about 35 pA, around −150 dB below full scale.
LE in turn puts 55 mV (3 ns edge) or 89 mV (1 ns edge) onto CLK at U1. That's far below the ~1.4 V switching point, so it cannot clock in a false bit. The 1 ns plot also shows the T-split shelf on LE's falling edge at U1, near 1.65 V. That's the edge that latches the DAC.
Where the CLK energy actually goes
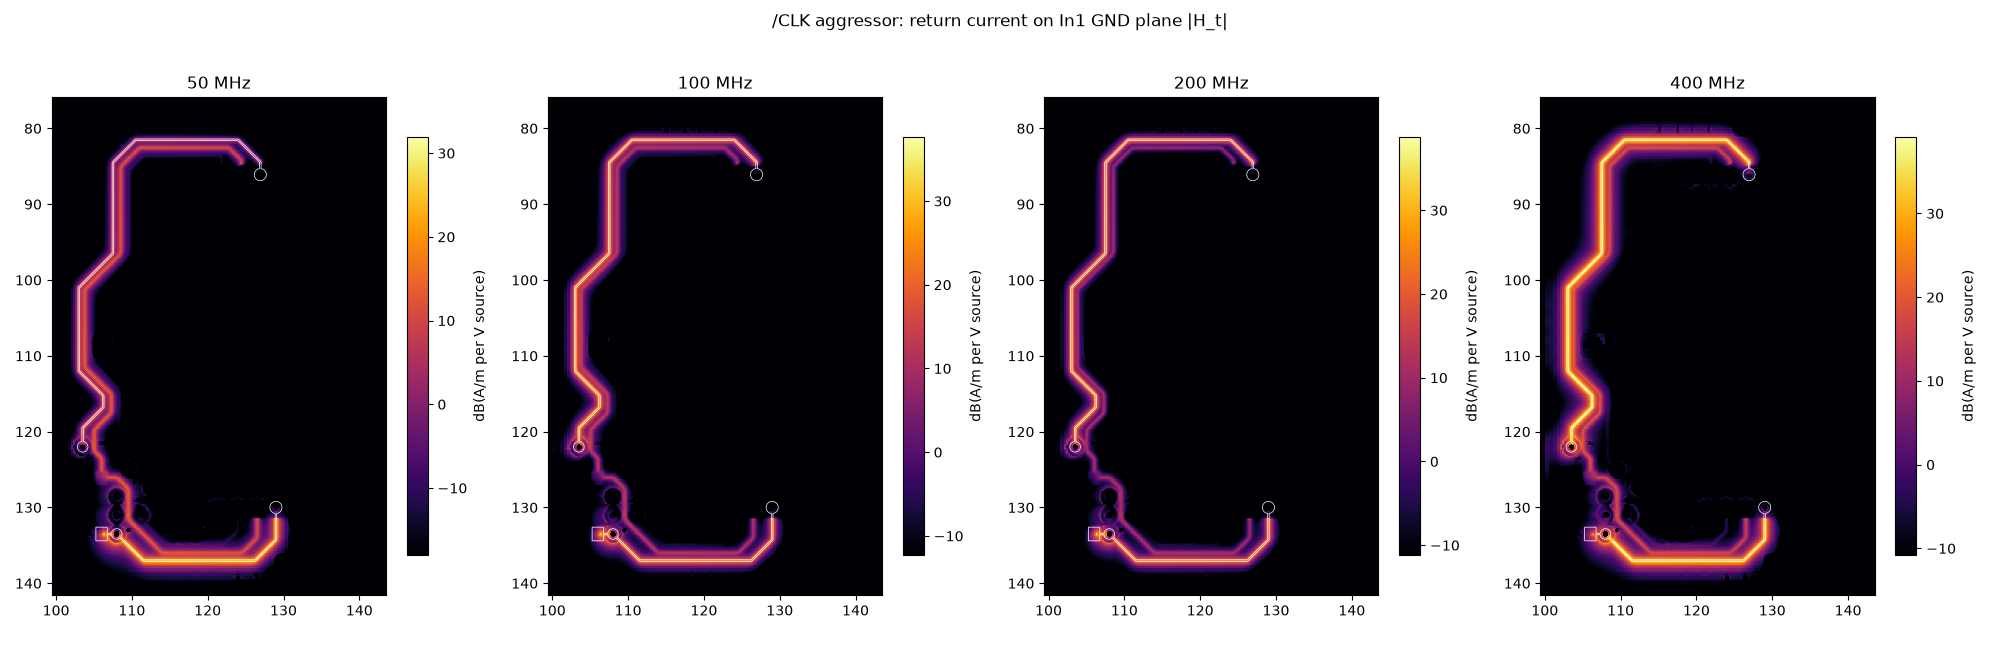
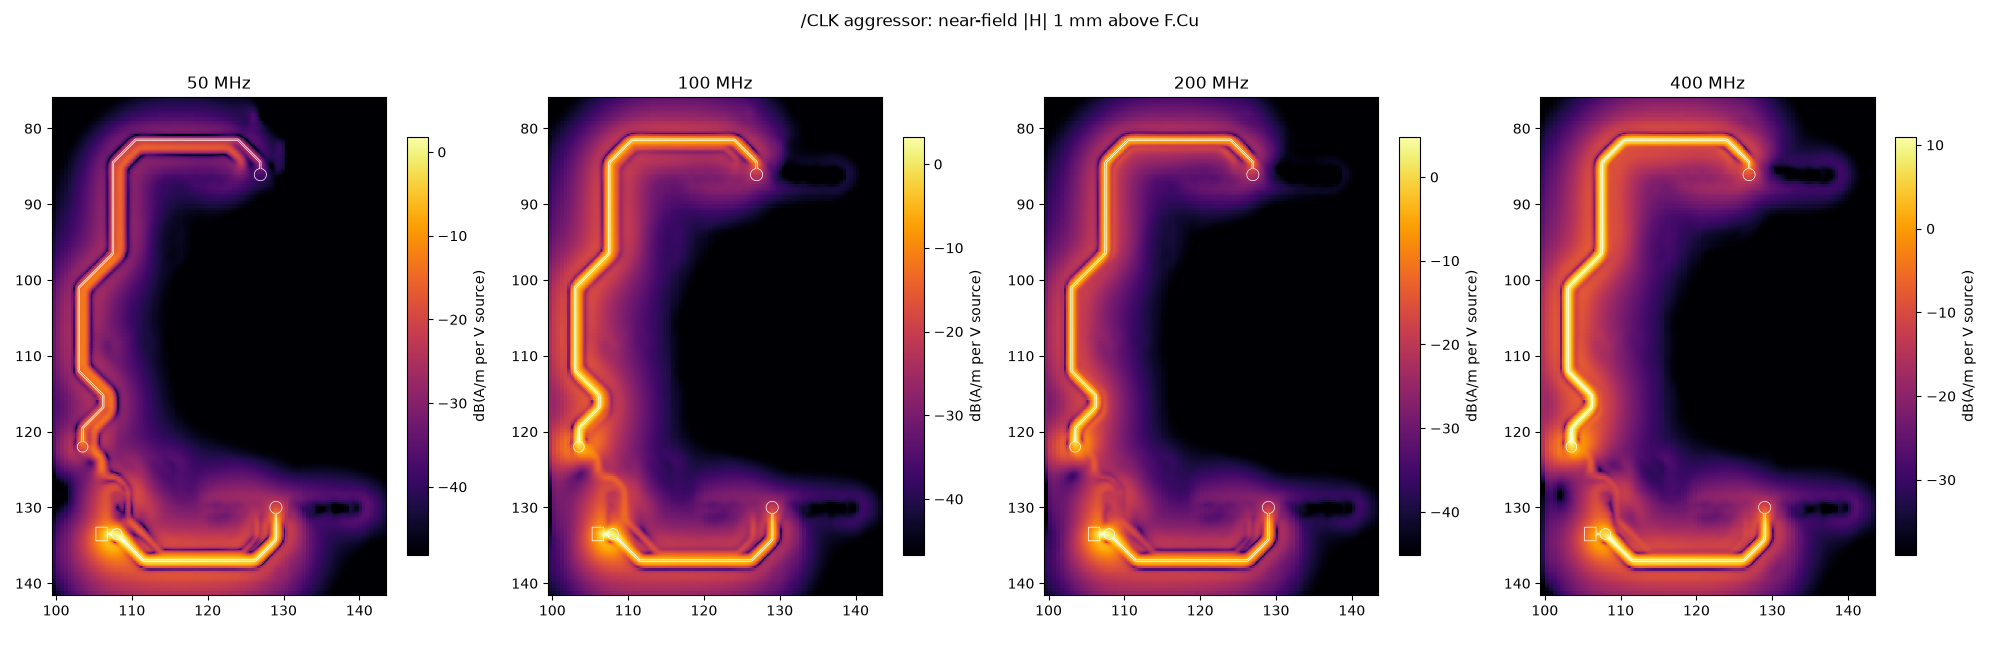
Ground voltage drop from the DAC's own current
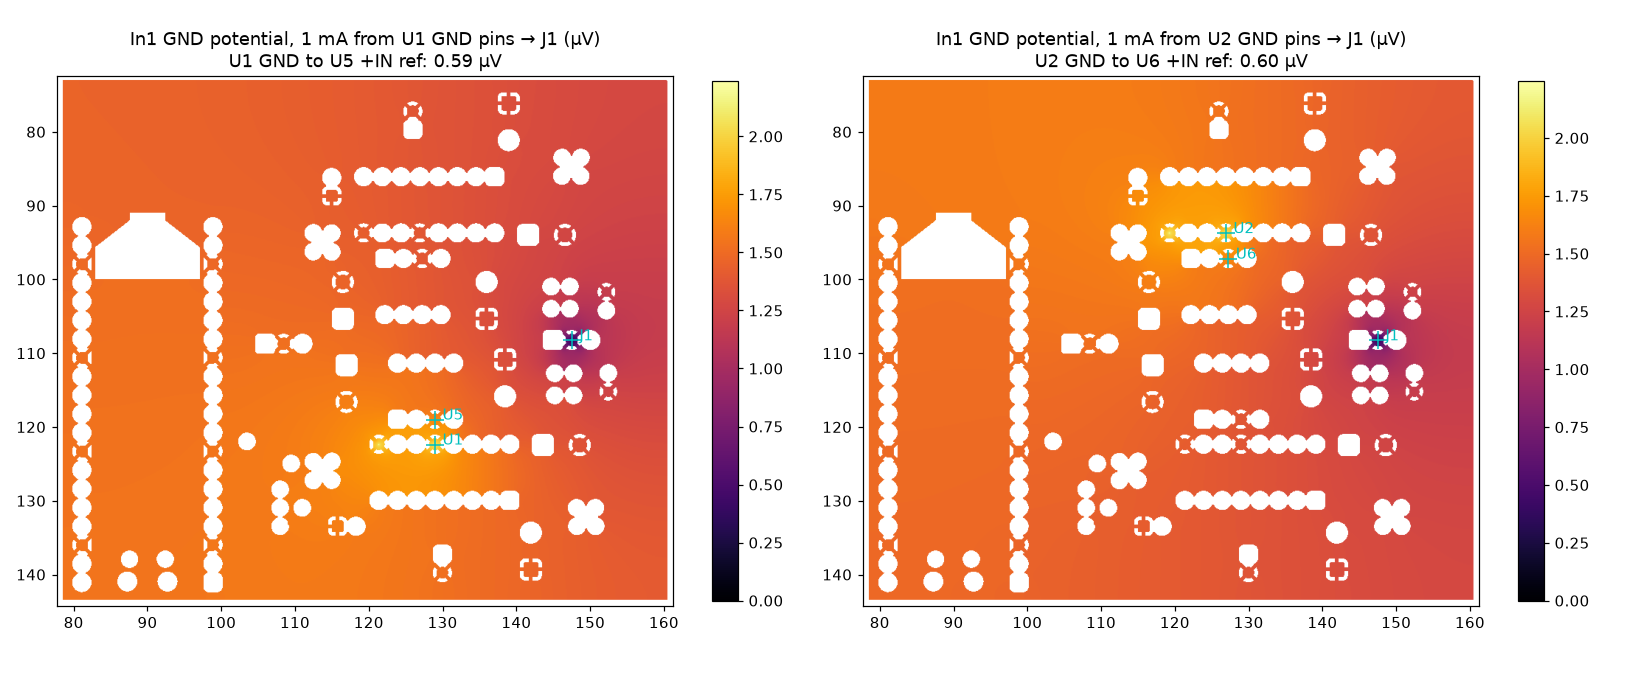
The R‑2R ladder returns signal-dependent current through AD1862 pins 9 and 12. Any plane voltage between those pins and the op-amp's ground reference adds directly to the output. With 1 mA flowing from each DAC's ground pins to the supply connector J1, the difference is 0.59 µV (left) and 0.60 µV (right). That's about 0.2 LSB per mA at the output, so the plane is not a limit.
Decoupling seen from each AD1862 supply pin
Every supply pin has a 100 nF within 2.0–2.6 mm and a 47–100 µF electrolytic within 4–7.5 mm. Above 10 MHz the curve is set by the DIP socket and lead inductance (about 4 nH), which no board change can remove. Between 100 kHz and 5 MHz the electrolytics' ESR dominates, with an anti-resonance against the 100 nF near 4.5 MHz. A 10 µF X7R beside each 100 nF fixes that band.
Assumptions to keep in mind
- RP2040 pad resistance (40 Ω at 4 mA) and AD1862 input capacitance (5 pF including socket) are typical values, not measured. The conclusions hold across the 2–12 mA sweep.
- The summing node is modelled as 50 Ω at high frequency. The real node is the OPA134 input in parallel with 47 pF to ground and 47 pF to the output, so the true injected current could be a little higher or lower.
- Copper is a zero-thickness sheet with no solder mask. Real 35 µm copper with mask brings Z0 from 73.8 Ω to about 65 Ω, which shortens the shelf only slightly.
- The clock model reproduces the divider's pattern exactly. Raspberry Pi does not specify random jitter from the RP2040's PLL and output pins; the 30 ps and 2 ps cases are assumptions, and the chart shows the cost of any value.
- The full-wave model is a 43 × 65 mm crop. The Pico module and the far right of the board are outside it.
- Field maps are relative (per volt of source). They show where energy concentrates, not compliance margins.
- Items marked diyAudio are builders' reports, cited by post number; weigh them as such.